3.3 Use your light sensor
On this page:
Light sensor activities
Exploration:
- What is the ambient light intensity of the room you are in?
2. Explore the properties of your sensor:
a. How does covering the light sensor with you hand change the light intensity reading?
b. How does moving your hand closer to and farther away from the light sensor affect the light intensity?
3. How consistent is your sensor?
a. Take three measurements in a row. Are they similar?
b. How confident are you that the sensor is precise? In other words, do you believe that when you take more than one measurement they will be the same?
5. How does light intensity vary in your home?
a. Where are the places with the most light? Where are the places with the least light?
b. How does light intensity vary when you turn on or off the light in your room? How does it vary as you move closer to or away form a window?
Anchoring Applications
Below are various activities you can do to use your sensor to explore the environment around you, from urban to rural settings. If you only have an indoor space available to you, try Activity 1. If you have a small yard, garden space or park access try Activity 2. Try all the activities as you can based on the nearby environments available to you!
Activity 1 (Indoor): Create a light map of your room or house to identify best spots for house plants
For this activity, you will need your computer and assembled light sensor, a piece of paper, and a pen or pencil to write with and measuring tape.
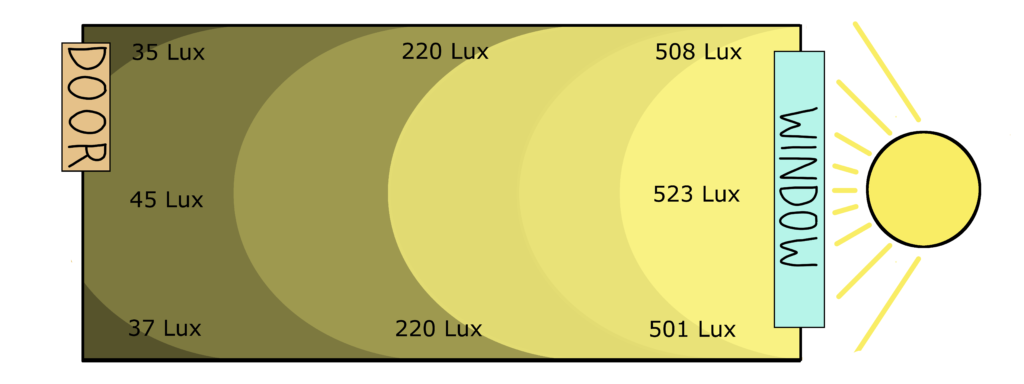
1. Start by drawing a diagram of the room you are going to make measurements of, including any doors and windows (use Figure 3.7 as an example). Identify a distance from the floor to take all your measurements at. For example, take all measurements three feet from the floor and in the same orientation (always pointing straight up towards the ceiling). Make sure you aren’t blocking the sensor with your body or a surface. Taking consistent measurements in this way will help you better compare measurements throughout the room.
2. Using your light sensor, measure the light intensity in the middle of the room and record it on your diagram. Take multiple measurements (5 or so) to see if they’re all the same. Are any of the measurements very different from the others?
3. Starting in one corner of the room, measure the light intensity in each corner and in the middle of each wall.
a. If there are any windows, be sure to note them on your diagram and take additional measurements near the center of each window.
4. Try making the light map again at different times of the day to compare light intensities in your room in the early morning, in the afternoon and at night.
Reflection
1. Looking at the light you just created, are there any patterns that you can see?
a. How much does light intensity vary across the room?
b. Identify the brightest and the darkest spots. Why might they exist?
c. Where would be the best places in your room to put a houseplant that requires high light? A houseplant that requires low light?
2. How might different rooms in your house compare?
3. How does the light intensity change as you move away from a window in your house?
4. How does the time of day influence the light intensity at different spots in your room?
Bridge activity: Create the same room map using the digital temperature sensor. Do patterns in temperature correspond with patterns in light?
Activity 2 (Outdoor): How does vegetation affect light intensity? How does light intensity affect plant growth?
For this activity you will need to find an area outside with a tree or bush that is off the ground. You will need your computer and assembled light sensor, a piece of paper, and a pen or pencil to write with and measuring tape.
1. Start by drawing a simple diagram of your selected plant. Measure the horizontal distance from the base of the plant to just beyond the farthest reaching leaves of the plant and include this distance in your diagram. Using your tape measure, map out 5 evenly spaced locations from the base to out from under the plant and mark them on your diagram. These will be your sample locations moving forward.
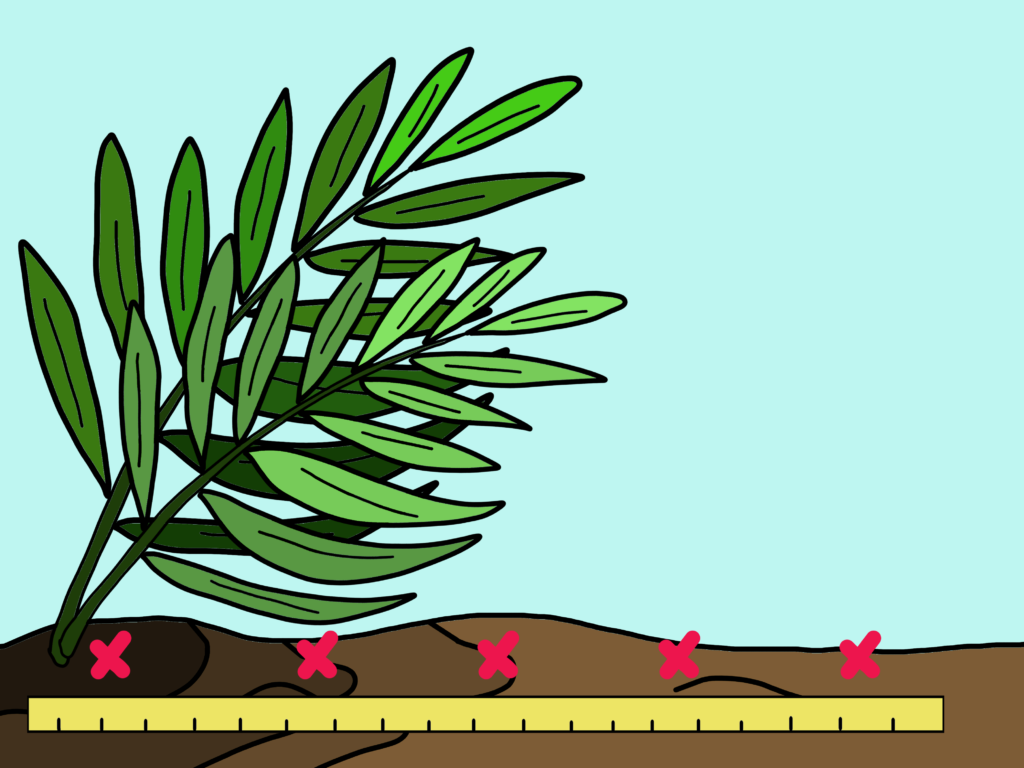
2. Use your light sensor to take a light intensity reading at the base of your plant. Make sure when you are taking a light intensity reading that you are always holding the sensor so that it is the same height from the ground and pointing directly up. Also be careful not to block the sensor with your body. This will ensure that you can compare light intensity readings across your different sample locations.
3. Record the light intensity reading on your diagram.
4. Repeat steps 2 & 3 at each of your sample locations making your way from directly under the plant to out from under the shade of the plant.
5. Try making the light intensity map again on a day with different weather at the same time of day as your original map.
a. Try making the map at a different time of day. Do you notice any differences in the light intensity as the weather/time changes?
Reflection
1. Look at the light intensity map that you just created. Are there any patterns you can see?
2. How does the light intensity vary as you move from the base of the plant to out from underneath it?
3. Look closely at the plant you selected and make a note of the type of leaves the plant has and how those leaves might affect your light intensity readings.
4. If you created the same map underneath a different type of plant how do you think the light intensity readings would change?
5. How do you think the weather and time of day might affect the light intensity underneath your plant?
6. Can you identify any new leaves on the plant you chose? Where are those leaves growing in relation to the plant as a whole? Where are the leaving growing in relation to your sample sites? Can you think of any connections between the location of the new leaves and your light intensity measurements?
7. If you were going to plant a new plant close to the one you are observing, where would you plant it? Would you plant it underneath your original plant? Why or why not?