2.3 Use your Sensor
On this page:
Temperature activities:
Exploration
- What is the temperature of the room you are in?
2. Explore the properties of your sensor:
a. Can you heat it up with your hand?
b. How fast does it take to heat up? Try recording the temperature after 10 seconds, 20 seconds, 30 seconds, and so on…
c. After how long does it no longer get hotter?
3. How consistent is your sensor?
a. Take three measurements in a row. Are they similar?
b. How confident are you that the sensor is precise? In other words, do you believe that when you take more than one measurement they will be the same?
4. Measure the temperature of the water coming out of your sink.
a. What temperature is the hot water tap? What about the cold water tap?
b. What is the range of water temperatures your sink can produce?
c. What is your optimal temperature for washing your hands? How about the other people you live with? Is it the same temperature?
5. How does temperature vary in your home?
a. Do you have a thermostat in your home? If so, does the temperature you measured match the thermostat?
b. What are the coldest places? What are the warmest places? Is there a draft, if so where is it, and how much colder or warmer is it than the rest of the room?
Anchoring Applications
Below are various activities you can do to use your sensor to explore the environment around you, from urban to rural settings. If you only have an indoor space available to you, try Activity 1. If you have a small yard, garden space or park access try Activity 2. If you have a few different environment types accessible to you (for example an agricultural field and a beach) try Activity 3. Try all the activities as you can based on the nearby environments available to you!
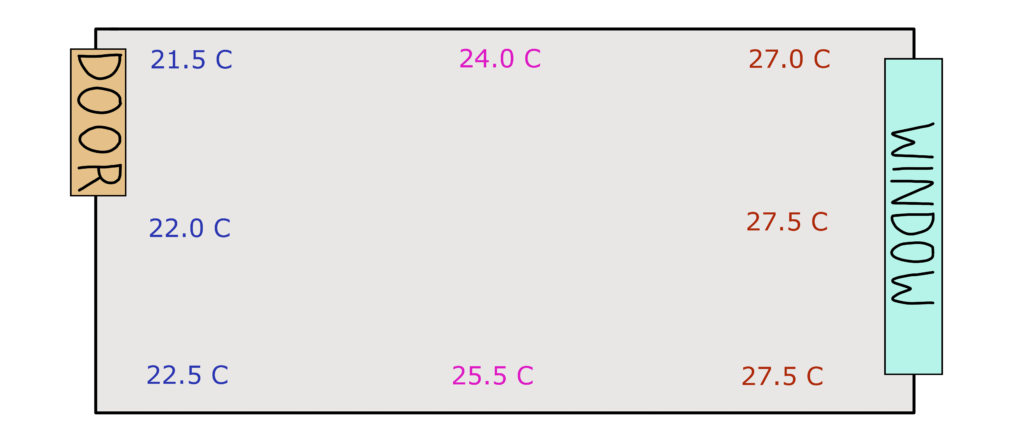
Activity 1: Create a temperature map of a room to identify sources of cold/warm air
For this activity, you will need your computer and assembled temperature sensor, a piece of paper, and a pen or pencil to write with.
1. Start by drawing a diagram of the room you are going to make measurements of, including any doors, windows, and air vents (use Figure 2.7 as an example).
2. Using your temperature sensor, take the temperature of the air in the middle of the room and record it on your diagram. Take multiple measurements (5 or so) to see if they’re all the same. Are any of the measurements very different from the others?
3. Starting in one corner of the room, measure the temperature in each corner and in the middle of each wall.
a. If there are any windows, doors or door frames, be sure to note them on your diagram and take additional measurements near the center of each window or door.
b. When measuring the temperature near a wall, window, or door, be sure to hold the sensor close to the surface without touching it.
Reflection
1. Looking at the map of temperatures you just created, are there any patterns that you can see?
a. How much does the temperature vary across the room?
b. Identify the hottest and coldest spots. Why might they exist?
i. Is there a draft, doorway, or other feature that might explain a different temperature?
2. How might different rooms in your house compare?
3. How does the temperature change as you move away from a heater, radiator, or air conditioner in your house?
Bridge activity: Create the same room map using the digital light sensor. Do patterns in light correspond with patterns in temperature? If you were going to place a houseplant in the room, where would be the best place for it to grow?
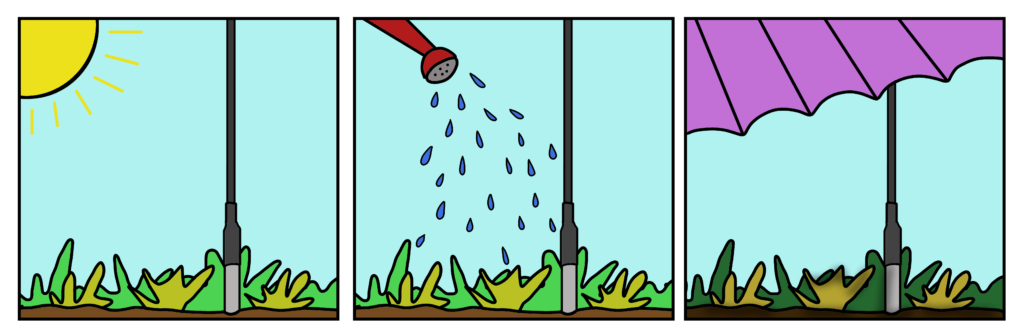
Activity 2: Measure how shade and water change the temperature of the ground
For this activity, you will need to find an area inside or outside that is in the sun. You’ll need your computer and assembled temperature sensor, plus:
- 1 cup of water
- 1 object to create a shadow such as a chair or box
- A toothpick, pen or piece of paper you can use to mark three spots in a patch of grass.
- Something to keep track of time such as a watch, clock, or timer.
- A piece of paper, and a pen or pencil to write with.
If you’re doing the activity outside on a patch of grass or dirt…
1. On a small area of grass or dirt, start by measuring the temperature of the soil by inserting the sensor 1 cm ( about one knuckle on your finger) deep into the ground, and record the temperature. Repeat this in a few different spots to see if it is the same across the area.
2. Identify and mark three spots in the grass and measure the temperature, making sure to identify which measurement corresponds to which spot.
a. The first spot will be your control to see what the temperature is like if you don’t make any changes.
b. The second spot will be used to measure how the moisture in the soil affects the temperature. Slowly pour 1 cup of water over this spot to allow the ground to soak up the water.
c. The third spot will be used to measure how shade affects the temperature. Arrange a box, chair, or another object near or on top of this spot so that it is shaded from the sun.
3. Wait 10 minutes after pouring the water and setting up the shade and take another measurement at all 3 spots. Repeat four more times for a total of 6 measurements at each spot taken over a period of an hour.
If you’re doing the activity inside or outside on concrete/rock…
1. In a small area under sunlight, start by measuring the temperature of the surface by placing the sensor on the surface/ground, and record the temperature. Repeat this in a few different spots to see if it is the same across the area.
2. Identify and mark three spots in the sun and measure the temperature, making sure to identify which measurement corresponds to which spot.
a. The first spot will be your control to see what the temperature is like if you don’t make any changes.
b. The second spot will be used to measure how water affects the temperature. Place the cup of water in this spot in the sun.
c. The third spot will be used to measure how shade affects the temperature. Arrange a box, chair, or another object near or on top of this spot so that it is shaded from the sun.
3. Wait 10 minutes after placing the cup of water down and setting up the shade. After 10 minutes, take another measurement at all 3 spots. Repeat four more times for a total of 6 measurements at each spot taken over a period of an hour.
Reflection
1. How do these different conditions affect temperature?
2. Can you make a map of soil or ground temperatures in your study area? How might this change over 24 hours? How can this help inform planting a garden where different plants have different temp/moisture preferences?
Bridge activity: Make a map of the soil or ground temperatures in your yard or other study area using the temperature sensor, then using the digital light sensor, record the light levels at the same spots. Do patterns in light correspond with patterns in temperature?
Activity 3: Compare soil temperatures of different nearby environments
This activity uses California as an example but these concepts are applicable to any rural area with an emphasis on agriculture.
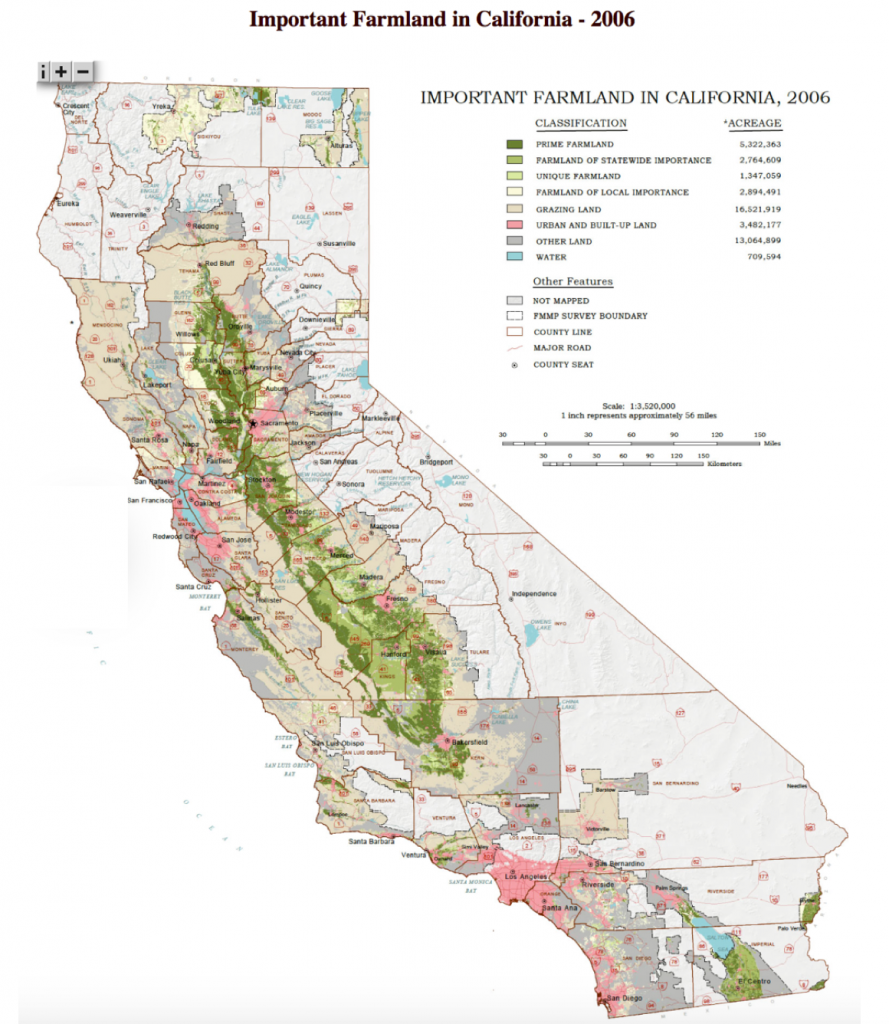
California Agriculture: Overview
California is a leading US state in agriculture, producing over a third of the USA’s vegetables and two thirds of the its fruits and nuts (CA Dept. of Food and Agriculture).
The map shows a large majority of the “Prime Farmland” located across the Central Valley of California. This 450 mile long strip that stretches from Bakersfield to Redding is responsible for large economic impacts.
The success of California’s agriculture can be attributed to the favorable conditions. These conditions include ideal weather, sunlight, water availability, and soil. Soil is the foundation of agriculture and it is important to recognize that not all soils are suitable for agriculture. Ideal soils for agriculture will have a balance in mineral components, soil organic matter, air and water, and other content.
There are various different kinds of soils, which are mostly composed of clay, sand, silt which can be distinguished by texture. Sand feels very gritty, silt feels smooth and soft like flour, and clay feels sticky. Texture determines qualities like drainage, aeration, the amount of water the soil can hold, erosion potential and even the amount of nutrients that can be stored. This helps determine what soils are suitable for agriculture.
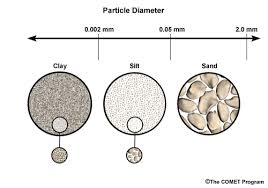
The figure to the left shows us the size of the different soil components (sand, silt, clay). Sand grains are about the size of a pin head. Silt particles are about the diameter of a strand of human hair. Clay particles are microscopic, about the size of a bacteria.
You can differentiate the three soil types using texture, with the following test:
- Grab a handful of damp soil. Squeeze the soil and rub it between your fingers to identify it’s texture. Does it feel gritty, smooth or sticky?
- Make a ball of soil, throw it in the air and catch it. If it falls apart, it it contains mostly sand. If it sticks together, it contains mostly clay.
How do you think soil properties impact agriculture?
For this activity, you will need:
- Constructed battery operated temperature sensor
- Laptop (optional)
- Pen and Paper to record your data
- Cup or bottle or water
- A object to create shade like a small cardboard box
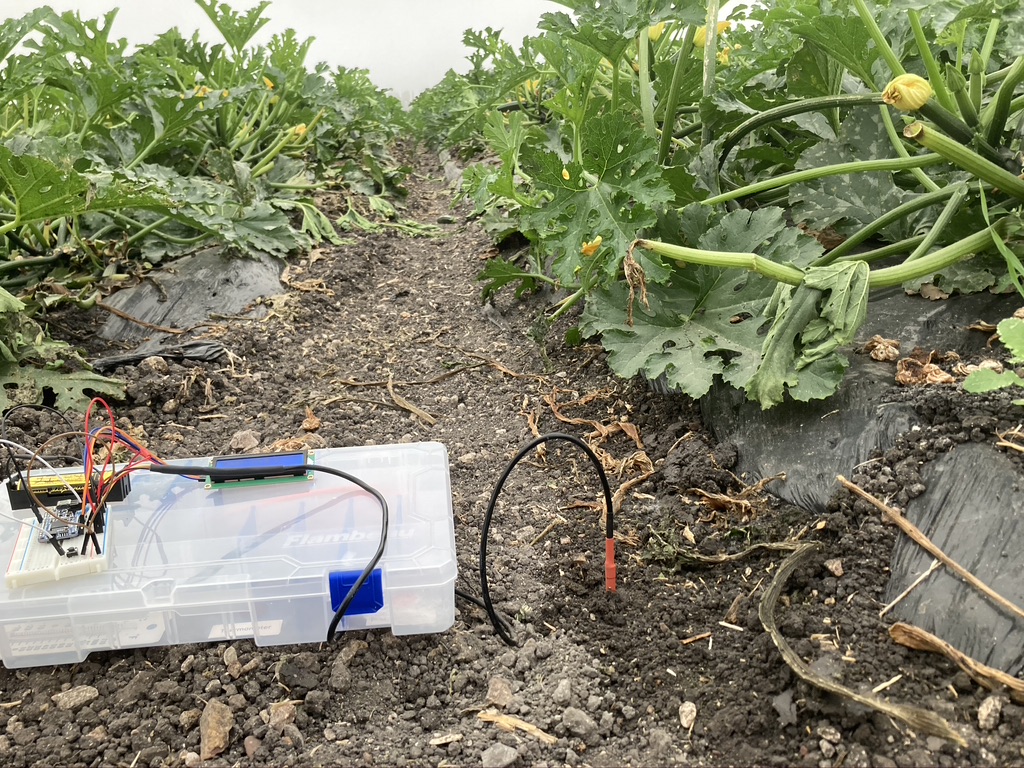
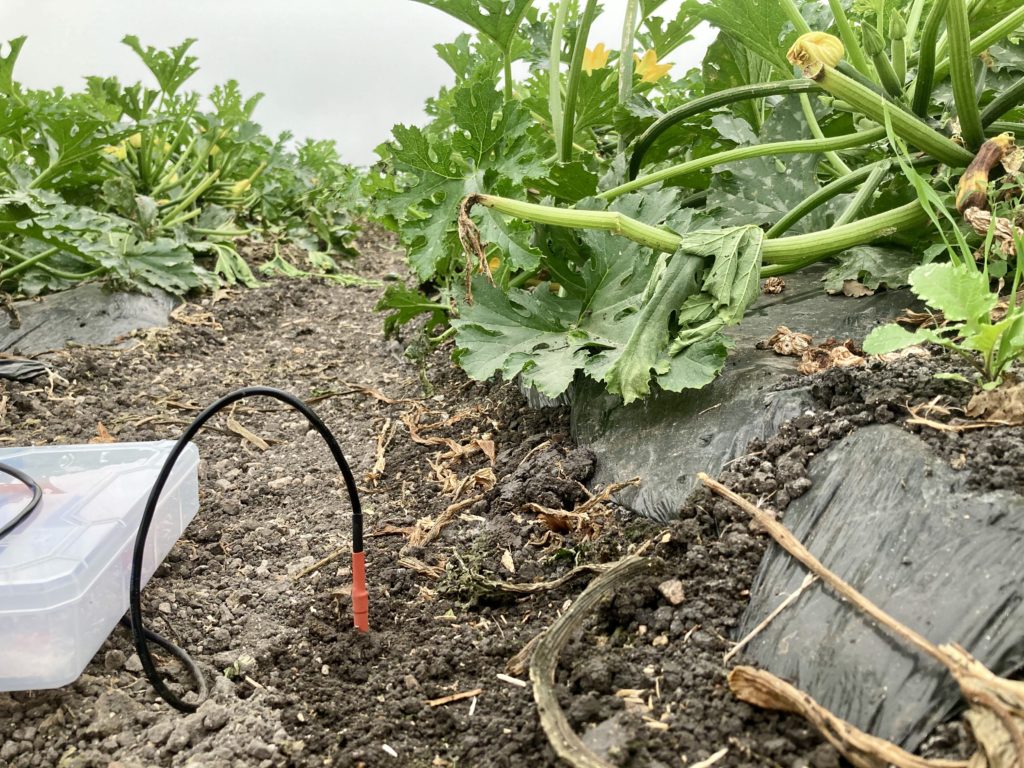
Location 1: Agricultural Field/Garden
Visit an agricultural field or vegetable garden near you. Take a look around this environment. How much vegetation is growing around you?
Before you start, identify the type of soil in this area using the ball or squeeze method described above. What type of soil is dominant here? How do you know?
Identify three different soil spots and prepare to take temperatures
- The first spot will serve as a control with no changes
- In the second spot, pour a glass of water and let it soak into the soil
- In the third location, create a shaded region to keep direct sunlight from coming into contact with the soil where you are measuring
Take the temperature of all three spots and record your measurements. To do this, make sure you insert the temperature sensor ~2cm underground. Utilize your finger or a pencil to create a small hole in the soil to facilitate the measuring process.
Take a total of six measurements at each spot over 30 minutes, at 5 minute intervals. Use the data table below to record your data.
Data Table: Location 1
Soil type: _________________
Treatment | 5 minutes | 10 minutes | 15 minutes | 20 minutes | 25 minutes | 30 minutes |
Control | ||||||
Wet | ||||||
Shade |
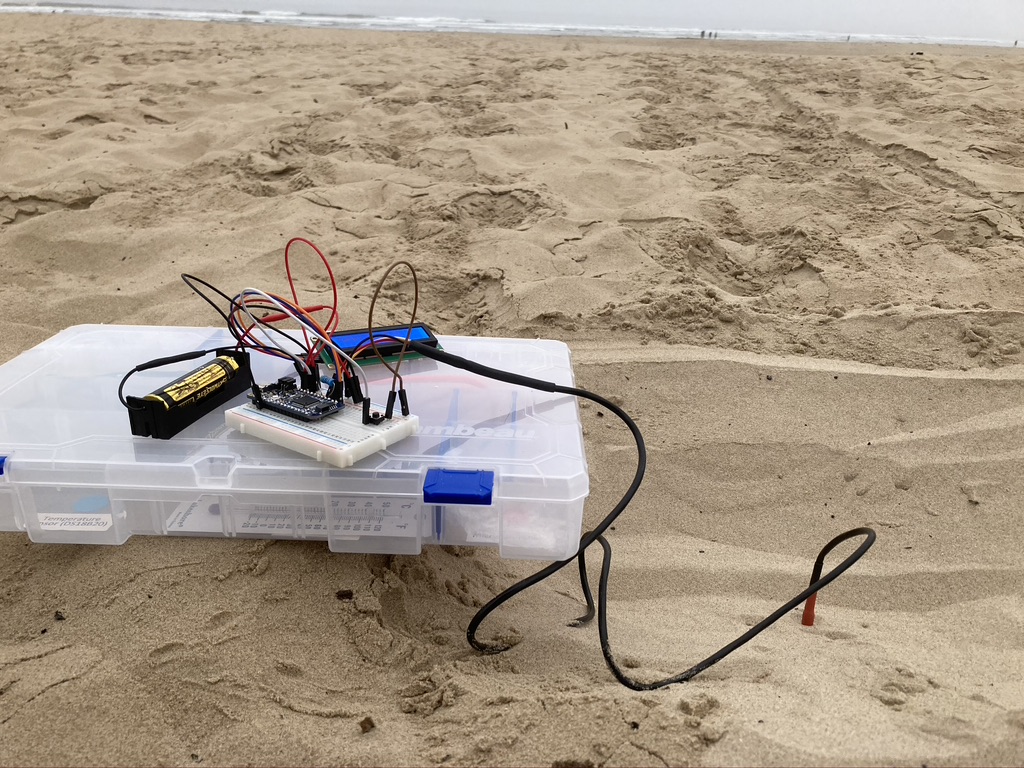
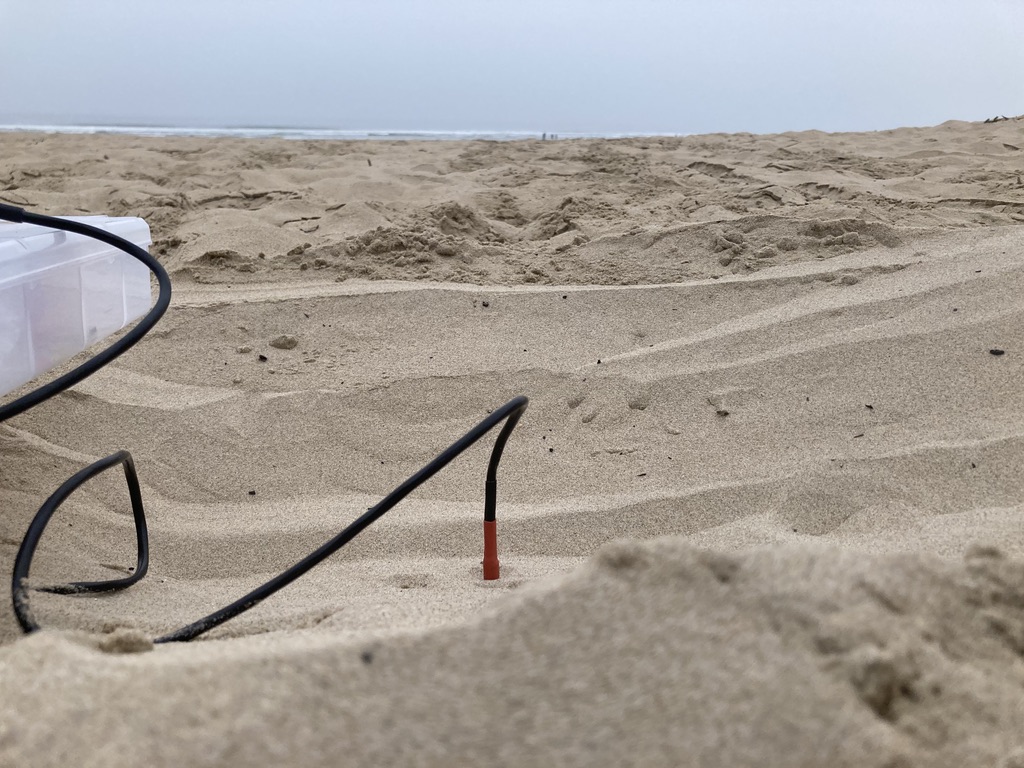
Location 2: Beach
Visit a nearby sandy beach. Again, take a look at your surrounding environment. How much vegetation is growing around you? How is this different from the agricultural field you visited previously?
Before you start, identify the type of soil in this area using the ball or squeeze method described above. What type of soil is dominant here? How do you know?
Set up three spots where you will monitor temperature over time using the same steps as in Location 1.
Data Table: Location 2
Soil type: _________________
|
Treatment |
5 minute |
10 minutes |
15 minutes |
20 minutes |
25 minute |
30 minutes |
|
Control |
||||||
|
Wet |
||||||
|
Shade |
Reflection:
1. What are the differences between the soil types of the environments you visited?
2. How does shade and moisture impact temperature in each soil type?
3. What do your results tell you about different soil properties such as structure, texture, etc.?
4. Use you results to explain why the majority of important crop yields might be in the Central Valley of California and not near the Coast.
5. What do you think is the best soil type for crops and why?