1. What is the thermistor resistance at room temperature?
a. What happens to the resistance as the temperature increases? b. How does the resistance change if you heat it up with your hands?
2. How fast does it change as you warm it (record resistance after 10, 20 and 30 sec)?
Activity: Calibrate thermistor
For this activity, you will need your computer and assembled thermistor sensor, plus:
1. 5 cups 2. Hot tap water from the sink 3. Ice cubes 4. A thermometer 5. A piece of paper, and a pen or pencil to write with.
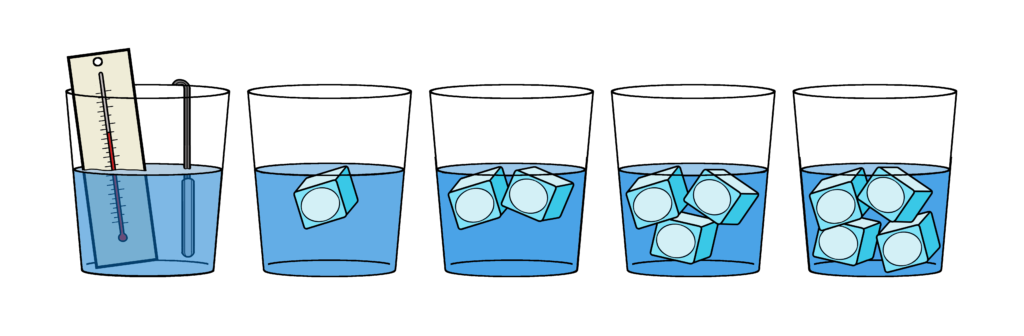
1. Prepare 5 water baths of different temperatures by adding a different number of ice cubes to hot water. For example:
a.Water bath #1: Hot Water Only b. Water bath #2: Hot Water + 1 Ice Cube c. Water bath #3: Hot Water + 2 Ice Cubes d. Water bath #4: Hot Water + 3 Ice Cubes e. Water bath #5: Hot Water + 4 Ice Cubes
Prepare water baths in cups and place them on top of an absorbent surface like a towel.
2. Create a spreadsheet (either digital or by hand) where you will record temperature (measured from the thermometer) and resistance across the thermistor:
Water
Temperature
Thermistor Resistance
Hot Water Only
Hot Water + 1 Ice Cube
Hot Water + 2 Ice Cubes
Hot Water + 3 Ice Cubes
Hot Water + 4 Ice Cubes
3. Place the thermistor and thermometer into the first water bath. Record the temperature with a thermometer and record thermistor resistance using your microcontroller. Collect 3 independent thermometer readings and 3 independent microcontroller readings, each a few seconds apart.
4. Repeat the previous step with each water bath, wiping off the thermistor and thermometer before transferring them to the next cup.
5. Create a graph of temperature vs. thermistor resistance using the values you wrote down in your table. If you make the graph using spreadsheet software (such as Microsoft Excel or Google Sheets), you can add a trendline. This trendline is your calibration curve, an equation which you can use to quantitatively describe the relationship between temperature and resistance. If you are drawing your graph by hand, you can estimate this trendline by drawing a line that passes through all of your measurements.
6. Now, you are set up to use your thermistor as a temp sensor. You can now measure temperatures by recording resistance and using your calibration curve to figure out what the temperature is. This is what the DS18B20 digital sensor is doing when it returns a temperature for you.
Reflection
7. What is the relationship between temperature and thermistor resistance?